Wow, it’s been more than two years since my last blog post. Time flies! But now, in 2023, I am eager to start filling this blog with cool and useful content, and I hope to maintain it for a long time.
As a welcome back post, I want to share an unpacking of a random sample of the Redline stealer that I found inside Malware Bazaar. The purpose of this post is not to analyze the malware, but rather to dive into the process of manual unpacking and extract deep information about the packer itself.
While writing this post, I discovered that this is an updated version of the packer that was described by Fumik0, in 2021. Although there have been some minor changes to some of its components, I will still use this sample to demonstrate the unpacking process.
Spliting the multi-stage loader
This sample loads its final payload in a multi-stage procedure, which means that there are a couple of steps involved before the actual malware is executed.
The bad, the good and the ugly unpack formula
Most of the unpacking is done by monitoring memory allocations, breaking at VirtualAlloc or LocalAlloc, and verifying any memory protection modifications with VirtualProtect and so on. However, for the purpose of this analysis, I want to focus on a more precise approach by examining the unpacking code itself.
This means that we first need to reverse the binary statically and determine exactly where we should look. In most cases, you will find a shellcode for analysis. You can identify it by following the code flow until you encounter an indirect jump, a function pointer call in the decompiler view, or something like jump rax or call rax in the disassembler, it will not be always that easy but for in general if you are not dealing with code obfuscation that is the way to go.
So, our steps for a successful unpacking will be as follows:
- Locate where the shellcode will be executed.
- Dump the raw shellcode.
- Reconstruct the code inside IDA, define struct types, and understand what the code does.
- Repeat the previous step for each stage of the unpacking process.
- Fully recover the final binary.
With that in mind, let’s get started!
Finding where to stop
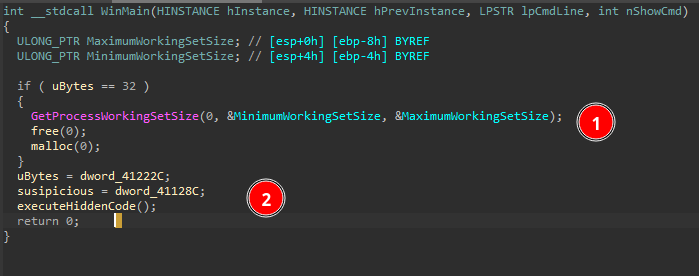
This sample employs a lot of junk and unused functions. At first glance in (1), we can see that we are looking at functions that have no use at all. It’s common for malware to use obfuscators that insert dummy code flows and function calls.
Also, note that in (2), some pointers are filled with data that is responsible for:
- uBytes: the amount of bytes needed to allocate the shellcode memory
- suspicious: the shellcode information struct, which we will talk about later.
The juicy part is at sub_403340 (executeHiddenCode). Let’s dive in and search for any function pointer calls.
Function pointers
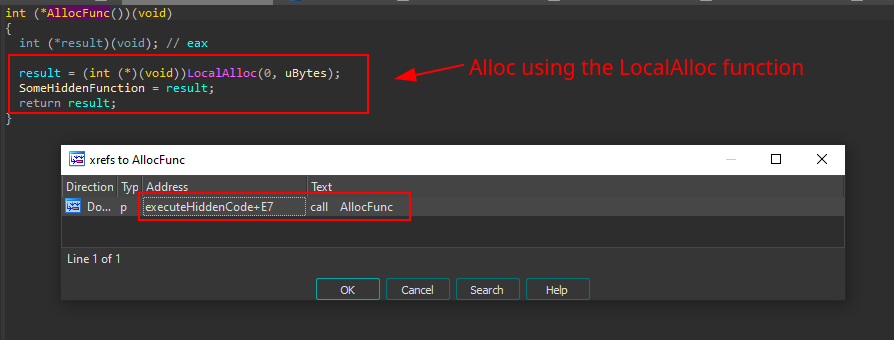
At the end of the function, it’s possible to see a call to a function pointer SomeHiddenFunction (dword_4B6B98). As it turns out, this memory region is allocated at runtime, and it’s fairly easy to find where using the xrefs:
Looking at the references to this memory area, it’s pretty clear that we should at least look at the only place where there is an assignment to this memory area: mov SomeHiddenFunction, eax. From there, it’s possible to follow the code flow to understand how this function is built.
Indeed, the function is being allocated at runtime by using the LocalAlloc function. By looking at the xrefs to this allocation function, it’s possible to identify that the executeHiddenFunction is responsible for calling it.
Later on, the memory area permissions are changed dynamically to allow code execution using the VirtualProtect function:
Shellcode structure
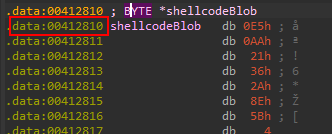
Do you recall the suspicious variable mentioned earlier? It’s actually used as a trick to hide the real encrypted shellcode offset. The trick involves pointing to an invalid memory area and then adding a fixed value of 732475 to it, which ultimately points to the real shellcode blob array address.
In other words, the actual address of the shellcode starts at 0x35FAD5 + 732475 = 0x412810.
In my first analysis, I did not pay much attention to the encryption scheme used in this code, as I was able to easily dump the shellcode inside x64dbg by breaking at the SomeHiddenFunction call. However, after reading the article by Fumik0 which analyzes a similar packer, I realized that the encryption scheme used here is the same as in the other packer: the Tiny Encryption Algorithm TEA (Tiny Encryption Algorithm).
TEA is a symmetric key block cipher with a block size of 64 bits, which was designed to be simple and easy to implement. It uses a 128-bit key to encrypt data in 64-bit blocks, and the same key is used for decryption
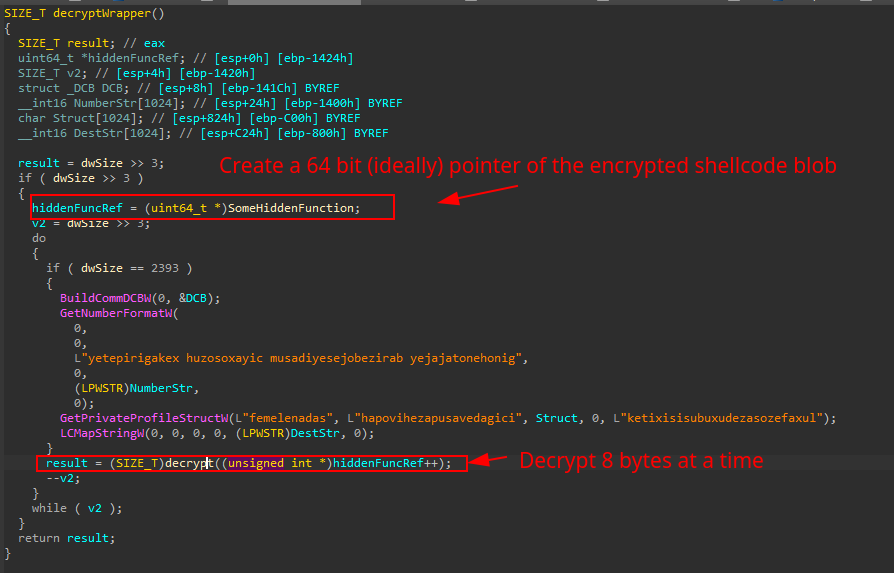
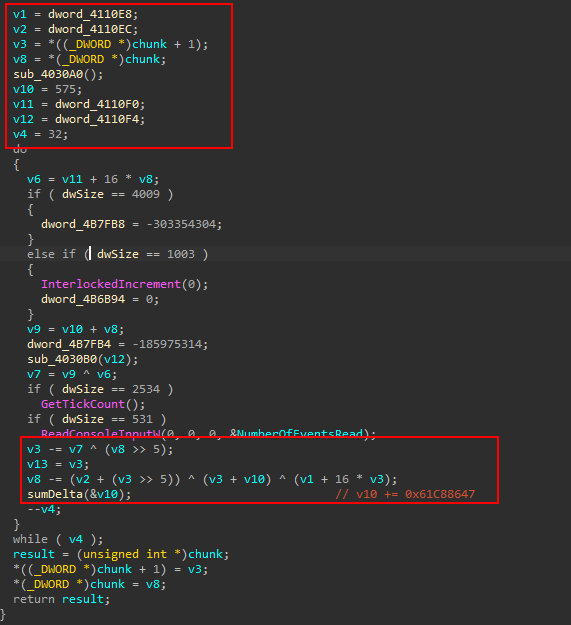
I’m not a cryptography expert so I can’t dive to much on this part, but here is where the decryption really happens:
Due to the large amount of junk code and dummy function calls in the binary, I’ve highlighted only the real decryption code. With the decryption key properly set, the algorithm is able to decrypt the shellcode and execute it in memory.
Dumping the first shellcode
As we have a good understand of the first shellcode stage of this loader, we can already dump it using x64dbg.
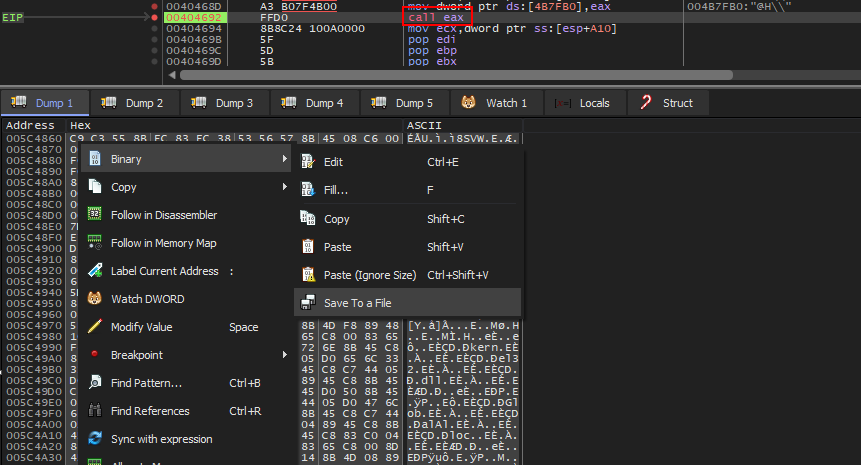
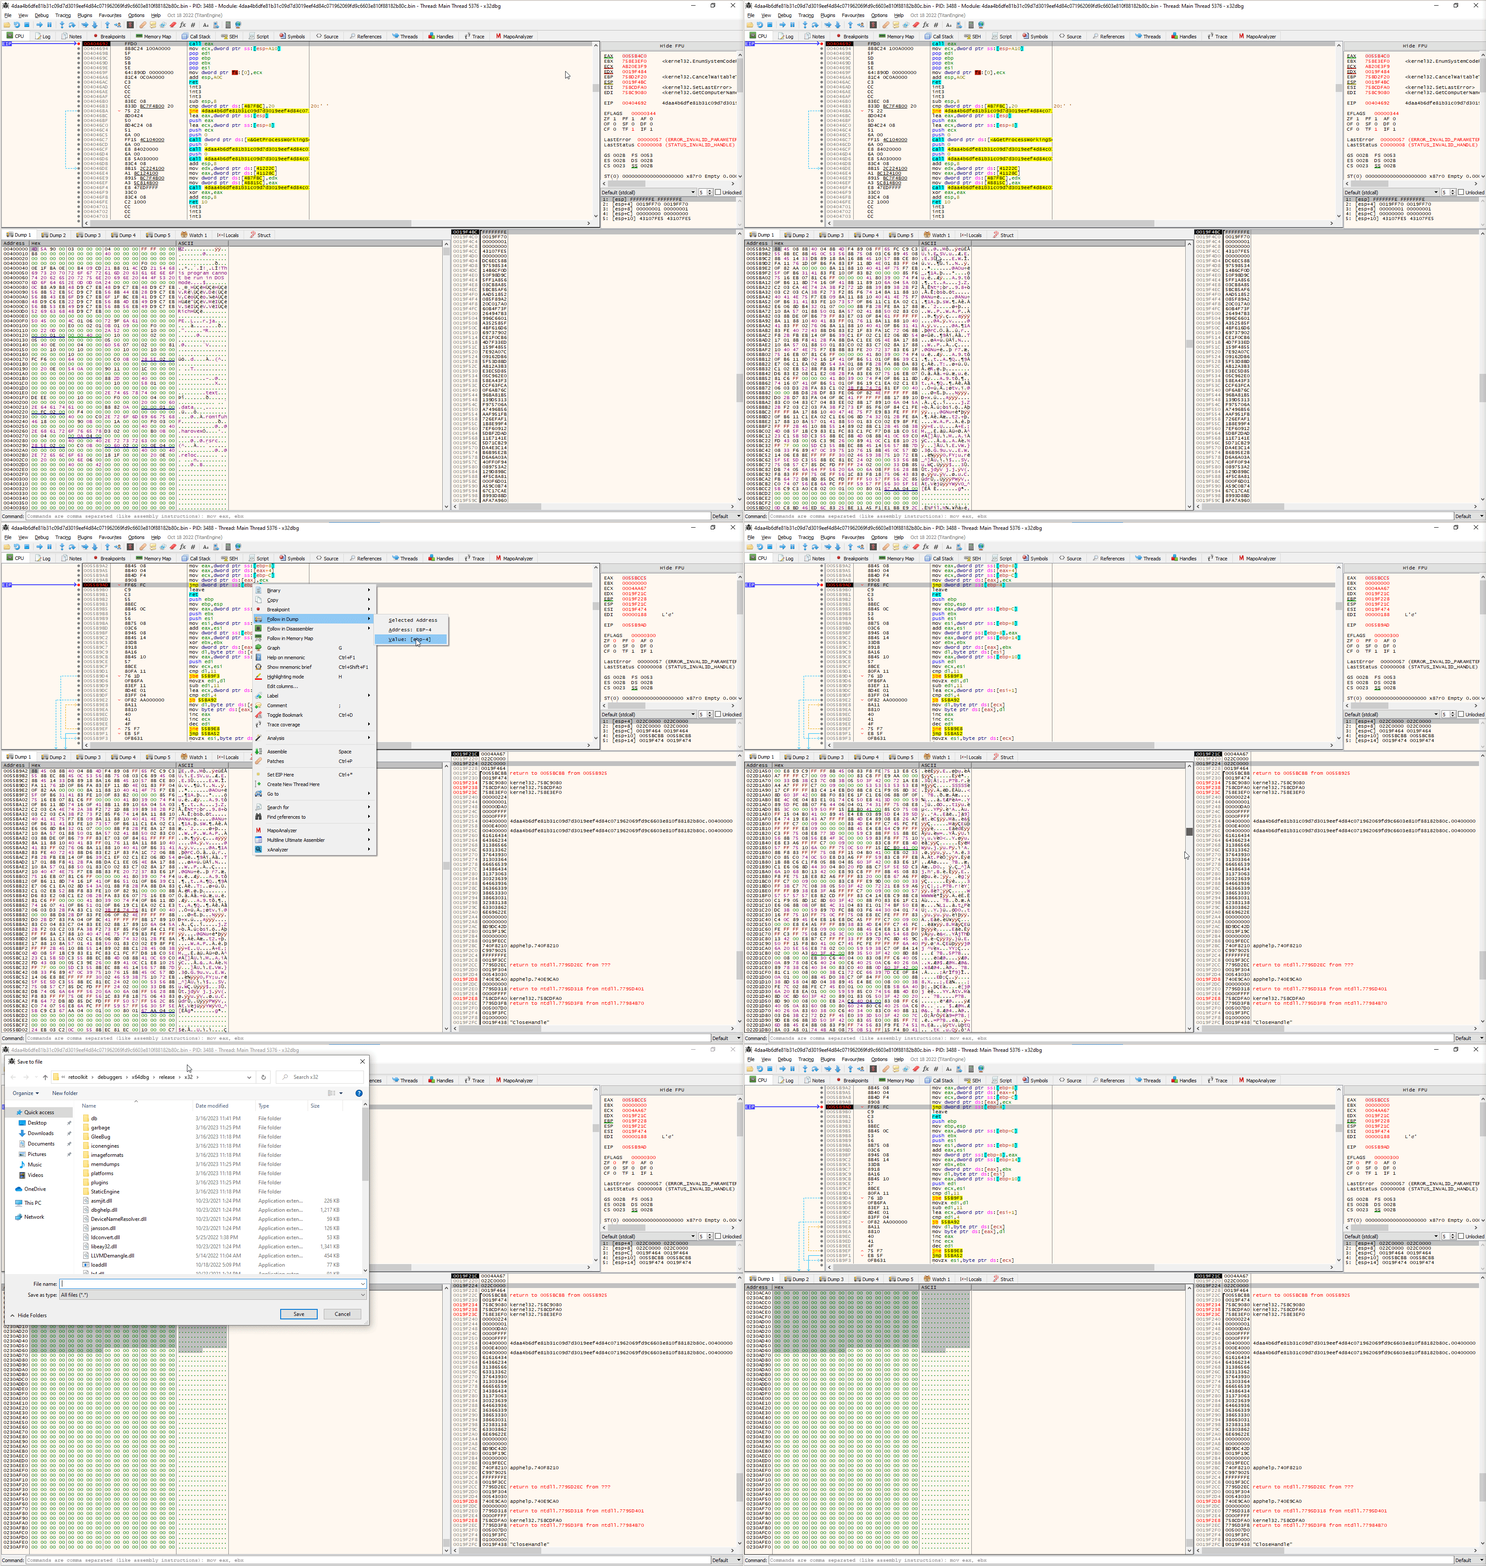
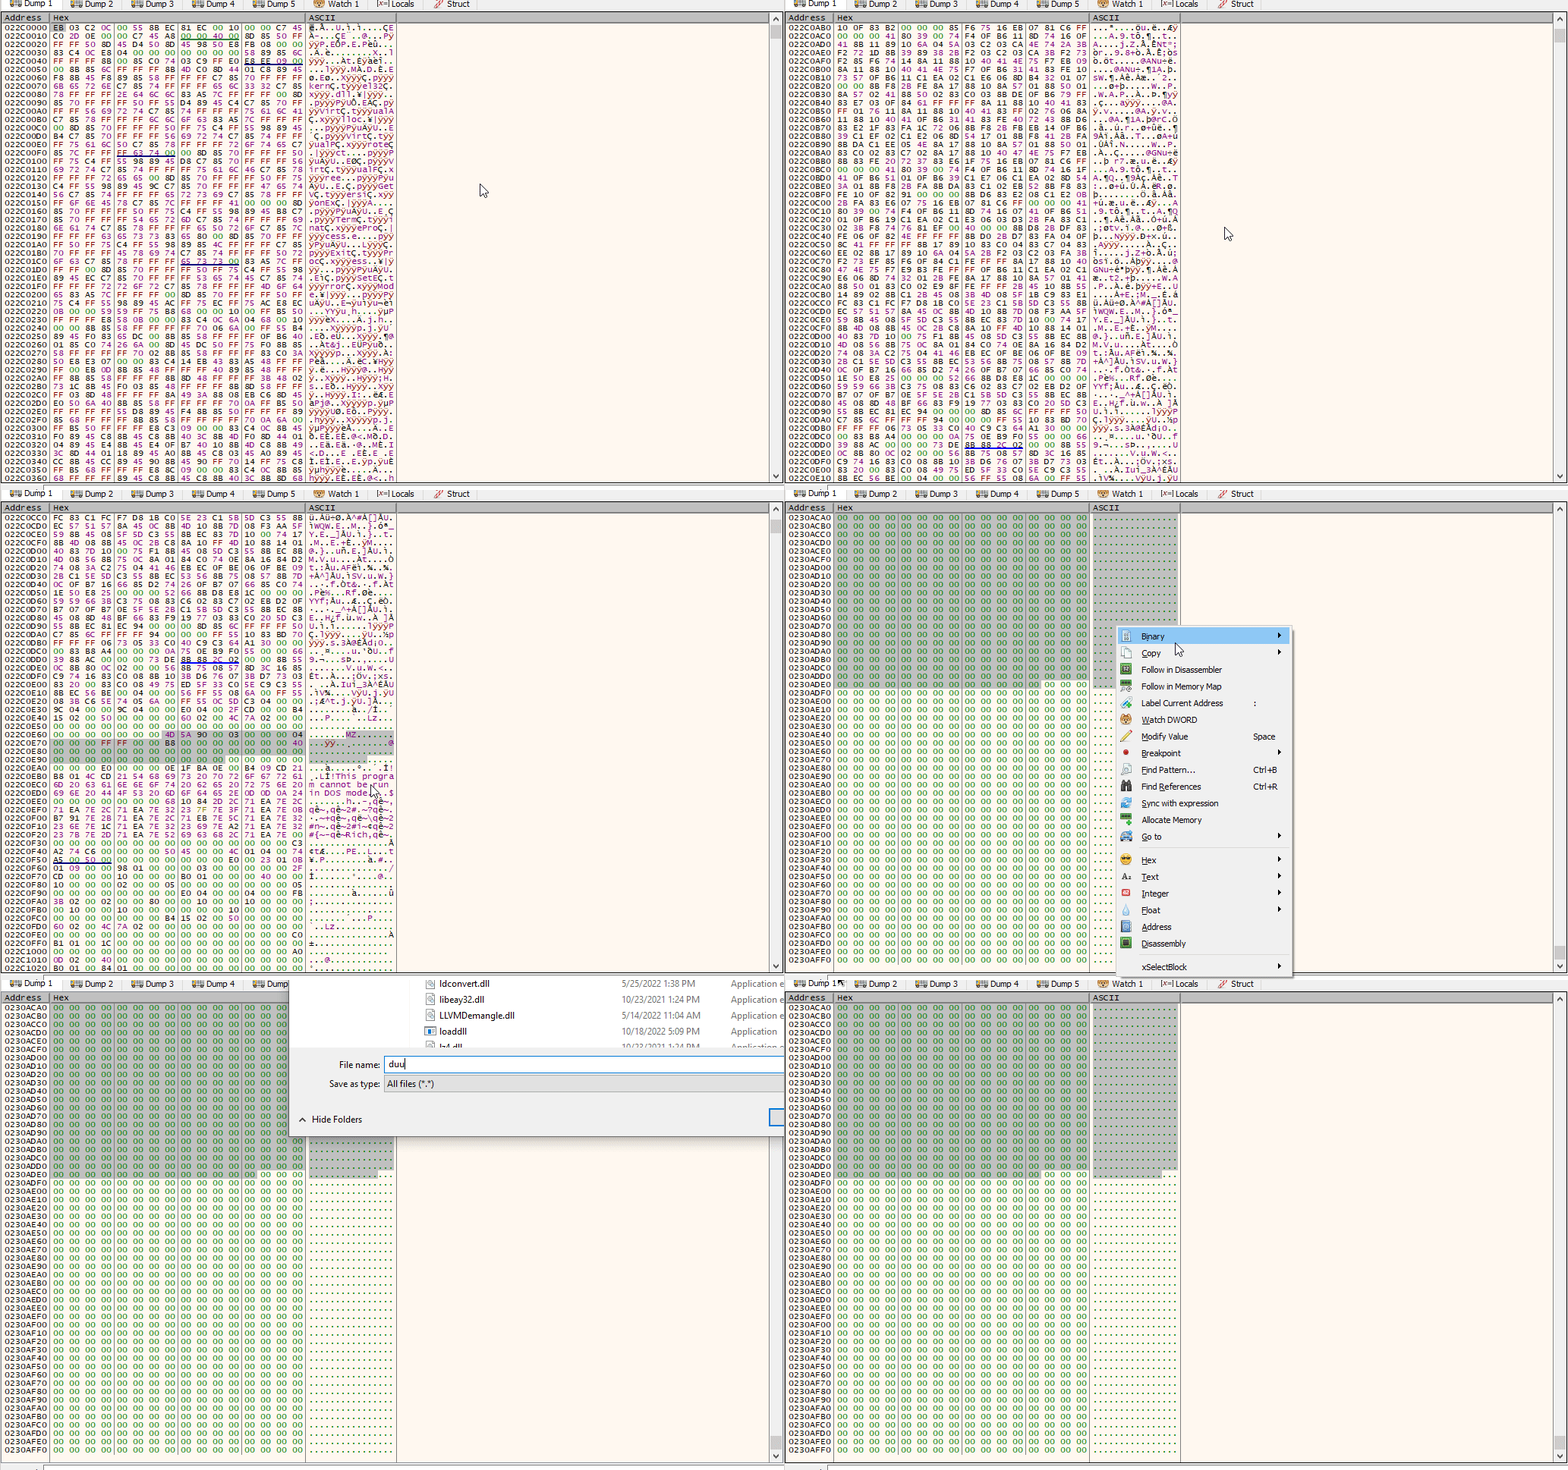
After triggering the breakpoint at call eax in someHiddenFunction(), we can navigate to where eax points on the dump tab and save the contents to a file. This will allow us to dump the first stage shellcode.
Shellcode Analysis - Stage1
The first stage shellcode is responsible for dynamically loading functions such as GetProcAddress and LoadLibraryA by parsing the Process Environment Block (PEB). It also uses API hashing to locate the DLL name and function name.
To analyze the shellcode in IDA Pro, we need to load the necessary type libraries first. Here’s how to do it:
- Open IDA Pro and load the target binary.
- Go to “View” -> “Sub views” -> “Type libraries” or just Hit
Shift + F11 - Load the
mssdk64_win10and click “OK”
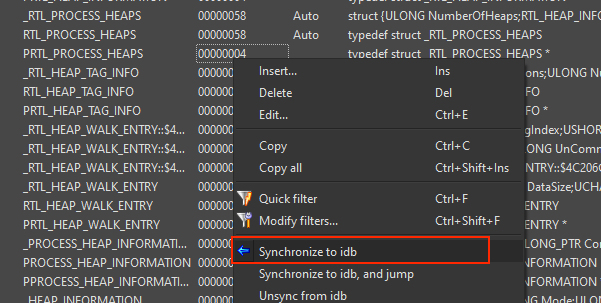
To enhance your analysis, it is recommended to include the complete definitions of the PEB and _LDR_DATA_TABLE_ENTRY structures. You can quickly achieve this by importing the definitions from the ntdll.h file available in the x64dbg repository. Simply copy the content of ntdll.h as a local type in IDA Pro by using the shortcut Shift+F1 > right click > insert > Ok, you will get some errors but that’s fine because you mostly will have a lot of structs in the local types view, mark everything with Ctrl+A and select “Synchronize to idb”.
Reversing the API resolver routine
When the shellcode is opened in the decompiler view, several interesting things can be observed:
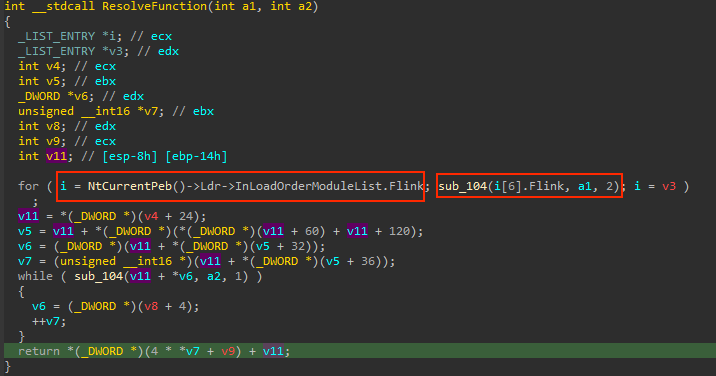
- A suspicious function that takes two parameters that looks like a checksum/hash
- An incremented and assigned pointer (a1)
- A large number of API function names
- The same pointer (a1) being accessed and called over and over
From this information, it can be deduced that:
- A1 is likely a struct
- The
sub_83function probably performs some API hashing routine - The functions are likely loaded using GetProcAddress
The supposed API hashing function contains the following code without analysis:
Upon inspection of the code, it becomes evident that the InLoadOrderModuleList structure inside the PEB is being accessed. This structure represents a doubly linked list that stores the loaded modules of a process in the order they were loaded. Each element of the linked list is an LDR_DATA_TABLE_ENTRY structure, which contains useful information about the module such as its DLL name, base address, and other attributes.
In addition, the code contains a few unresolved variables, which is a common occurrence when analyzing shellcode. To ensure precision, it is advisable to follow both the decompiler and disassembly views while rebuilding the code.
This will enable us to redefine the structures accurately and produce a more comprehensive understanding of the code’s functionality.
Rebuilding structs from the assembly view
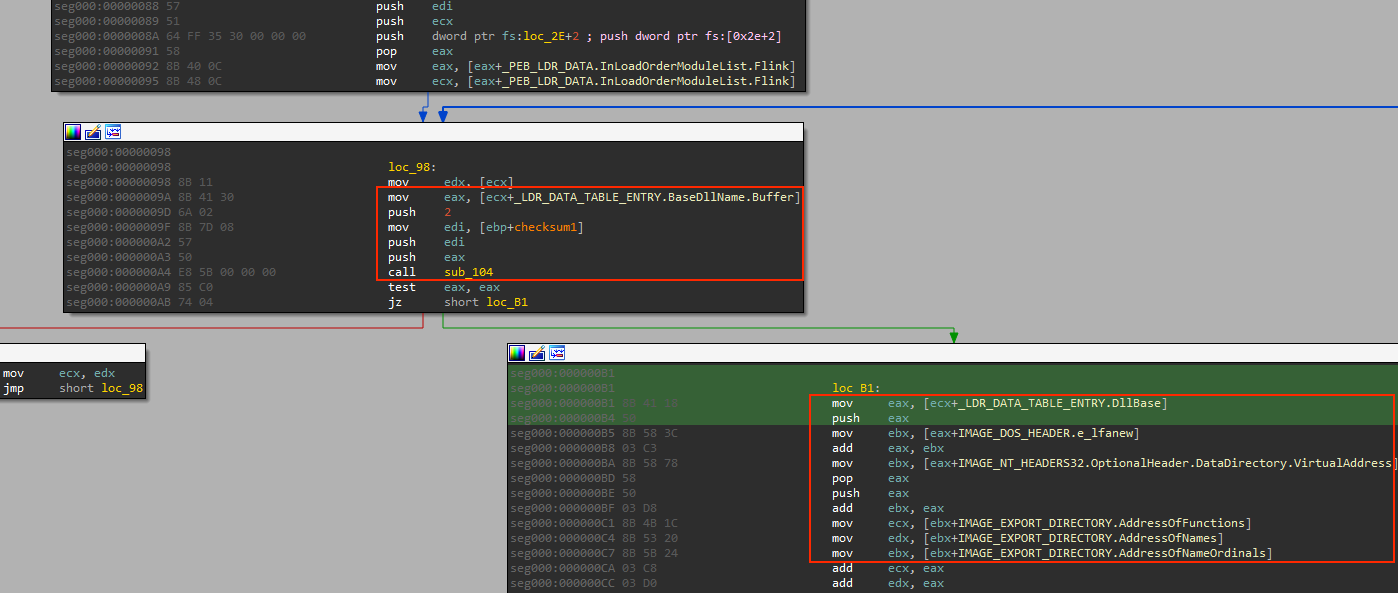
In the assembly code, it’s possible to see that the PEB address is being pushed into the stack and poped in eax, later on eax is incremented to 0xC, with this we can start to rebuild the structures by marking the register+offset and pressed T, which allows us to search for each struct that match to that offset access:
When rebuilding a shellcode, it’s important to ensure that you have all the necessary structs for the PE file and that they have the correct architecture. If you have already imported the type libraries, you can easily add the required structs by going to the ‘Structure’ tab, right-clicking and selecting ‘Add struct type’, and searching for the struct. In the case of a 32-bit shellcode, the following structs will be needed:
- IMAGE_DOS_HEADER
- IMAGE_NT_HEADERS32
- IMAGE_OPTIONAL_HEADERS32
- IMAGE_EXPORT_DIRECTORY
- IMAGE_DATA_DIRECTORY
The retyped assembly code looks like:
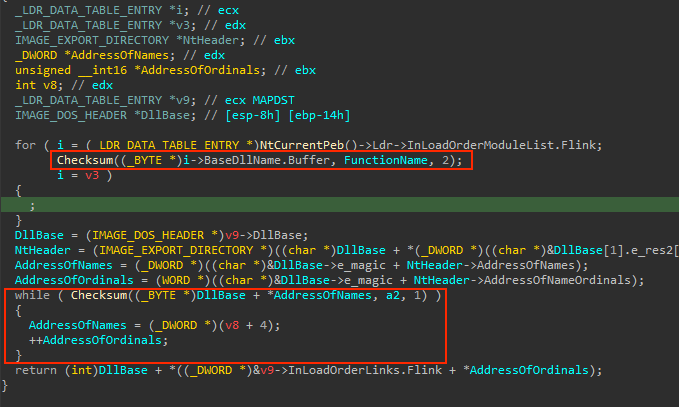
From the code, it’s clear that the shellcode is parsing each loaded module, retrieving its name and sending it to a function with the first parameter (checksum1). If the checksum matches, it proceeds to parse the in-memory PE file to retrieve the export table information. Knowing this, we can apply the same types in the decompiler view to understand the code better. However, it’s important to note that some of the decompiler code may be broken, so it’s best to cross-check with the disassembly view:
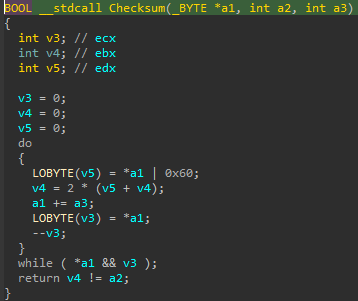
Great! So the resolving function utilizes the first parameter as a checksum to match the DLL name, and the second parameter for the exported function name. The checksum code itself is relatively simple. However, in order to determine which DLL and exported function is being searched, one would have to run the checksum code against all common Windows DLL files and their exported functions.
Discovering API hashing values using HashDB
Luckly for us there is an open-source project called HashDB that has already done the heavy lifting for us. It includes a collection of known API hashing algorithms and their respective values. In addition, there is an IDA Pro plugin available to assist with this task. If you are interested in learning more about it, check out this video.
I’ve choosen the shl1_add because this is not revil, but other algorithms may work as well (perhaps they use the same calculation). With knowledge of the algorithm, we can search for its values and determine that this checksum corresponds to the kernel32.dll module.
Actually, there was a hash collision with the first argument, but if you open this dropdown you will find the KERNEL32.DLL in uppercase and other non-native libraries, so it must be kernel32. Repeating the same process for the second argument will reveal that it is the LoadLibraryA function!
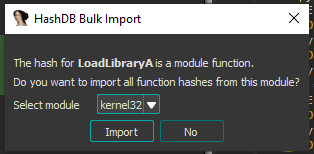
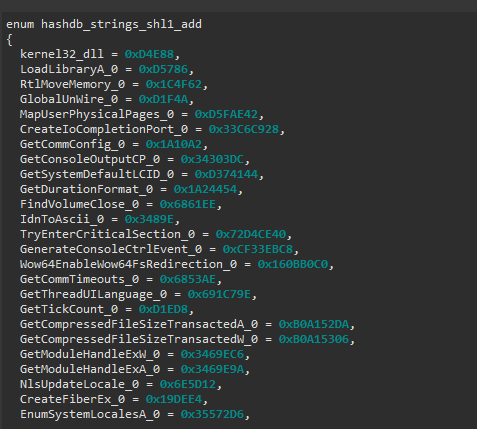
Now a cool feature of HashDB is that if there is a hit on a function name from a specific module, it can download ALL the hash values from that DLL for us and create an enum in the local types views. This enum can be used to automatically resolve everything at once, saving us time and effort.
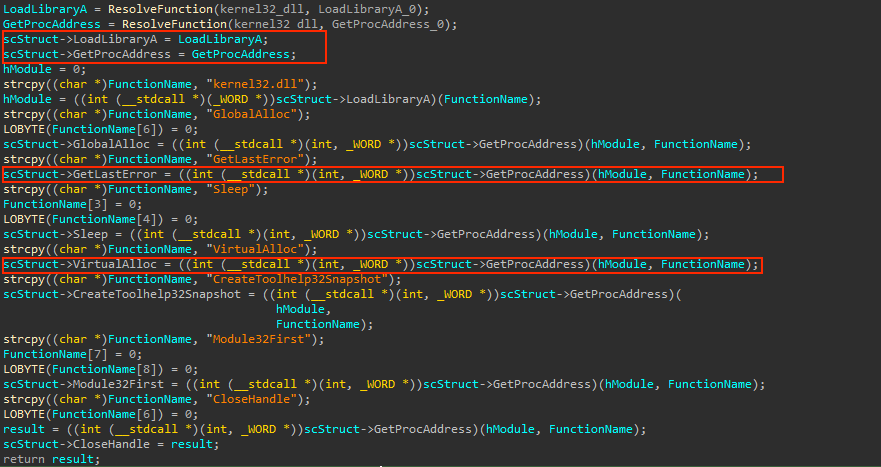
Now with all this information collected, we can change the function signature and automatically the names will be associeted to the hash values:
Rebuilding the Shellcode struct
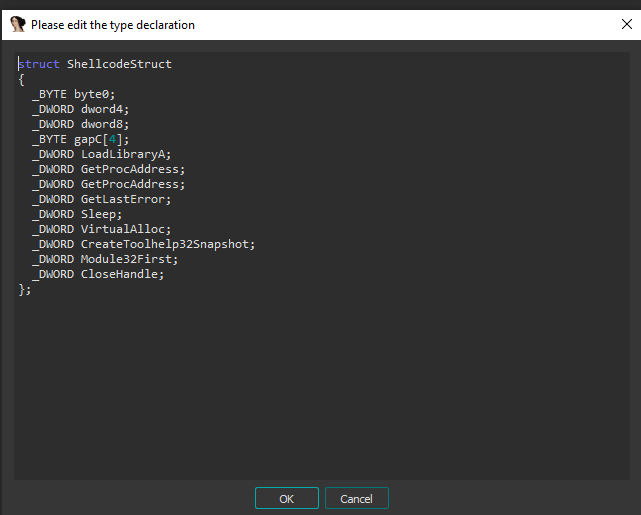
Perfect, now that we already know what functions are being resolved we can proceed, the next step is to rebuild the a1 struct, this is likely the Shellcode struct that hold every important informationl in order to work. It’s pretty easy to create a struct if there are being have access to this pointer, just right click the a1 variable and hit create a new struct type
Great! Now that we have identified what functions are being resolved we can proceed create a new struct definition for the a1 pointer. To create a new struct definition, simply right-click on the a1 variable, hit create a new struct type.
Make sure to include all the necessary fields and data types based on the information we have gathered so far. Once the struct definition is created, you can use it to reference the fields of the a1 struct and understand the overall structure of the shellcode.
So, by rebuilding the shellcode struct, we can see that it contains all the necessary functions required for its proper functioning. With this information, we can now exit the function and move on to the next steps with a newly created struct type!
The path to the last stage
Having access to the struct allows for replacement of all occurrences that use this structure. Once the API names have been resolved, a final function is executed to decrypt the next-stage shellcode and the actual packed PE file.
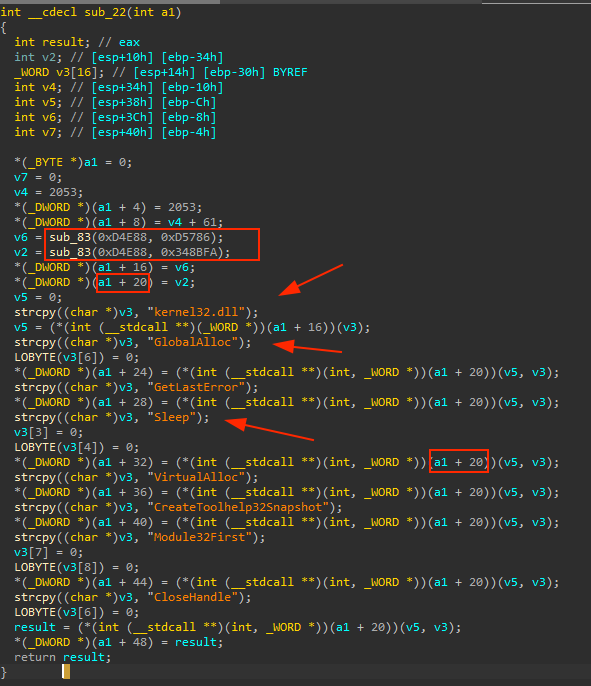
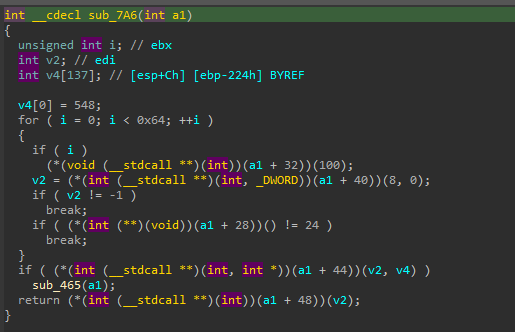
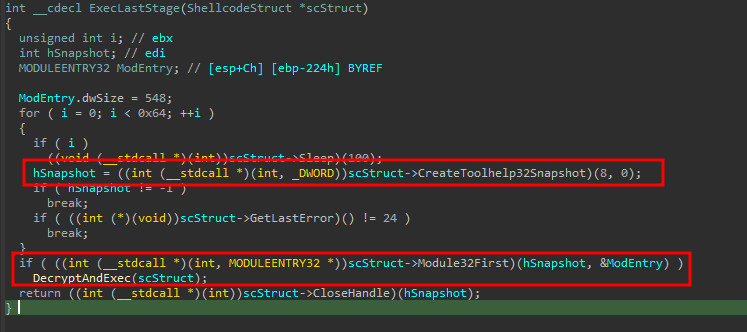
As an example, consider this function that takes the previously discovered shellcode struct. Although the code may appear difficult to read, we can simply replace the function signature to expect a ShellcodeStruct parameter, which will clarify the code:
Now it is clear what will happen. The function will use CreateToolHelp32Snapshot to capture information about all loaded modules, but will only select the first one. However, upon closer examination, it becomes apparent that this is a decoy code since none of this information will be used.
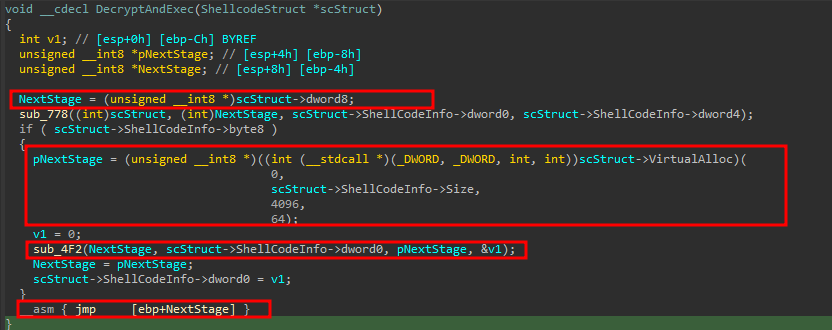
Instead, the DecryptAndExec function will allocate memory for the next stage, decrypt it and execute a direct jump to this area.
The DecryptAndExec function is a crucial component of the shellcode execution, this function accesses certain members of the ShellCodeStruct, but these are not relevant to our current analysis.
The function then proceeds to allocate memory using the VirtualAlloc function, with the memory location being stored in the pNextStage pointer. This memory area will be used to hold the decrypted and copied next stage of the malware.
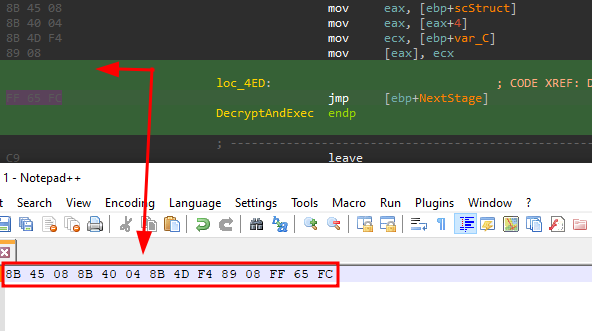
With this knowledge of when the next stage will be executed, we can continue our analysis in x64dbg. By creating a signature for the jmp instruction inside the shellcode, we can place a breakpoint before the dump of the second stage. This will enable us to analyze the second stage of the malware’s execution and gain further insight into the capabilities and behavior of the malware.
Dumping the last stage
By applying the pattern 8B 45 08 8B 40 04 8B 4D F4 89 08 FF 65 FC we will be able to find the jmp instruction showed earlier and also dump this second stage shellcode:
Perfect! Now, let me share a helpful tip to speed up the analysis process. As mentioned earlier, the final stage of the shellcode typically contains the unpacked PE file. Rather than dumping the entire memory content, it’s possible to extract only the PE file from the memory dump. This can save a considerable amount of time and resources:
Spoiler Alert: We’ve successfully unpacked the final stage!
The last shellcode is responsible for manually mapping the PE file, importing all the dependencies, and jumping to the entry point. Once the PE file is unpacked, one can continue the analysis without wasting time with the packer.
Conclusion
To sum it up, this article aimed to show a more professional and accurate manual unpacking method instead of relying on luck and common API breakpoints to find a PE file. While this packer was simple, other cases may not be so straightforward, such as when the MZ header is missing or there’s no PE file at all. However, this fundamental knowledge is still valuable.
I’m thrilled to be back writing for the blog and look forward to publishing more articles, not only on malware reversing.

