
Recently, I made the decision to finally publish my tool focused on unpacking, called Shinigami. The idea for Shinigami came to me two years ago, but I never actually implemented it until now. Initially, it was designed to dump implants injected via process hollowing. However, I also added support for generic malware loaders that implement manual mapping or shellcode injection. All of this is made possible by a memory page protection bit called PAGE_GUARD, which gives me the ability to detect when newly allocated memory is executed, read, or written to.
In this article, we will dive into how we can utilize this mechanism to detect code flow redirection to newly allocated memory areas, which are often associated with injection. We will also discuss the drawbacks and limitations surrounding this technique. Also I want to talk a little about the Shinigami memory monitoring implementation and it’s limitations, also address improvements for future versions.
How page guards works
Every time you allocate memory using API calls like VirtualAlloc or NtAllocateVirtualMemory, you have the capability to choose the memory protection for the page allocated.
There are several options available, such as executable (PAGE_EXECUTE), read-only (PAGE_READ), or write-only (PAGE_WRITE). By using the OR operator, you can combine these flags, creating combinations like PAGE_EXECUTE_READWRITE or PAGE_WRITE | PAGE_READ, among others. However, there is a special flag allowed by the Windows API called PAGE_GUARD and when this flag is set, it adds the GUARD page bit to the Page Table Entry (PTE).
Verifying the Page Table Entry (PTE) using WinDBG
Consider the following example code:
1
2
3
4
5
6
7
8
9
10
11
12
13
14
15
16
17
18
19
20
21
22
23
24
25
26
27
28
29
30
31
32

INT
main()
{
	DWORD OldProt;
	BYTE* RandomMemory = (BYTE*) VirtualAlloc(NULL, PAGE_SIZE, MEM_RESERVE | MEM_COMMIT, PAGE_READWRITE);

	if (!RandomMemory)
	{
		std::printf("Error allocating memory!\n");
		return EXIT_FAILURE;
	}

	std::printf("Allocated 0x%lx bytes at 0x%p without PAGE_GUARD\n", PAGE_SIZE, RandomMemory);

	for (int i = 0; i < 16; ++i)
	    RandomMemory[i] = (uint8_t) (i + 1);

	getchar();

	std::puts("Adding PAGE_GUARD");

	VirtualProtect(RandomMemory, PAGE_SIZE, PAGE_READWRITE | PAGE_GUARD, &OldProt);

        std::printf("Inspect the PTE of 0x%p", RandomMemory);

	getchar();

	VirtualFree(RandomMemory, NULL, MEM_RELEASE);

	return EXIT_SUCCESS;
}
Executing:
In this code snippet, we allocate some memory with read and write protections (PAGE_READWRITE). Then, we write some data to the allocated memory and use the VirtualProtect function to add a new protection, PAGE_GUARD, to this memory page. With WinDBG attached in kernel debugger mode, let’s examine the Page Table Entry (PTE) and see how the CPU views this memory area.
First find the process EPROCESS structure address and change the debugger to inside the process context:
1
2
3
4
5
6
7
8
9
10
11
12
13
0: kd> !process 0 0 PageGuardExamples.exe
PROCESS ffffbc0aa8f4c080
    SessionId: 1  Cid: 1268    Peb: ac42d18000  ParentCid: 1318
    DirBase: 17327b000  ObjectTable: ffff9489039bf4c0  HandleCount:  38.
    Image: PageGuardExamples.exe
0: kd> .process /i /r ffffbc0aa8f4c080
You need to continue execution (press 'g' <enter>) for the context
to be switched. When the debugger breaks in again, you will be in
the new process context.
0: kd> g
Break instruction exception - code 80000003 (first chance)
nt!DbgBreakPointWithStatus:
fffff805`34a055d0 cc              int     3
Now inside the process we can look at PTE, using the !pte command, before add the PAGE_GUARD bit:
Every virtual address need to be translated to a physical address when the paging is enabled in the OS, all moderns operating system works that way, in order to do this one must employ a paging algorithm, long story short, by the end of the algorithm there is a structure called Page Frame Number (pfn), which represents where in the physical memory the given page was allocated, this structure holds a couple of bits containing metadata about this area, in our case ---D---UW-V, which they mean:
- D
- Dirty flag, The Dirty flag indicates whether the page has been modified since its allocation, this happened when we wrote a couple of bytes into this memory (also this is a good place to verify if something has changed in some memory that you are monitoring for some reason)
- UW
- The User-Mode Write flag signifies that the page is writable by user-mode code. Since it was allocated by our process, we have permission to write to it.
- V
- The “Valid” flag simply indicates that the memory page is valid and usable.
Perfect, so everything looks good so far! Now, let’s explore what happens when we modify the protections and add the “PAGE_GUARD” bit.
Now, things are different. We can no longer see the contents of the PFN. We only have the information that a PFN should exist at address 0x1583ec with ReadWrite protections. This output essentially indicates that the memory is no longer accessible as it was before. When we added the PAGE_GUARD bit, the Memory Management Unit (MMU) took the responsibility of handling access to this page and raise a exception of type STATUS_GUARD_VIOLATION. This exception needs to be handled by our operating system.
Handling page fault exceptions
To handle the exception caused by the page access, we can register an exception handler using the Vectorized Exception Handling (VEH) mechanism. VEH enables us to register a callback function that gets called for every exception raised in our process. Within this function, we can filter out the STATUS_GUARD_VIOLATION exception and examine the exception context to determine if it occurred in the memory we previously allocated.
To achieve this, we first need to register an exception handler in our program using the AddVectoredExceptionHandler function. This function expects a callback function with the following definition:
1
typedef LONG (NTAPI *PVECTORED_EXCEPTION_HANDLER) (struct _EXCEPTION_POINTERS *ExceptionInfo);
Additionally, if we want our exception handler to be called before any other default exception handler, we need to set it as the first handler.
This can be useful if we want to be the first to handle this exception. Now, let’s add the exception handler to the previous code. It’s also a good practice to create a data structure to hold metadata related to the allocated memory.
For this example, I chose to use a hashtable (unordered_map) and a simple struct called MemInfo to store basic information about the memory. In the Shinigami project, I used the <list> from the C++ STL to hold a similar struct as used in this example.
1
2
3
4
5
6
7
8
9

struct MemInfo
{
	ULONG_PTR Address;
	SIZE_T Size;
	BOOL Prot;
};

std::unordered_map<ULONG_PTR, MemInfo*> TrackedMemory;
Logically, you will need to register the exception handler before any allocation that you want to monitor happens:
1
2
3
4
5
6
7
8
9
10
11
AddVectoredExceptionHandler(TRUE, VEHHandler); // <--- Register callback
BYTE* RandomMemory = (BYTE*) VirtualAlloc(NULL, PAGE_SIZE, MEM_RESERVE | MEM_COMMIT, Prot);
// Code related alloc check
// ...

MemInfo memInfo;
memInfo.Address = (ULONG_PTR) RandomMemory;
memInfo.Prot	= Prot;
memInfo.Size	= PAGE_SIZE;

TrackedMemory.insert( std::make_pair( (ULONG_PTR) RandomMemory, &memInfo) );
After setting up the example, when the code inserts the PAGE_GUARD bit into the memory page and any access is made to it, our VEHHandler will be called first. We can then filter out the exception type and verify if the exception occurred inside the monitored memory.
Processing the exception
To process the exception, we first need to filter and verify if the ExceptionCode corresponds to STATUS_GUARD_PAGE_VIOLATION. This information is part of a structure called EXCEPTION_POINTERS which holds details about the exception code that has occurred.
1
2
3
4
5
6
7
8
9
10
11
12
13
14
15
16
17
18
19
20
21
22
23
24
25
26
27
28
29
30
31
32
33
34
35
36
37
38
39
40
41
enum ACCESS_TYPES
{
	READ = 0,
	WRITE
};

LONG WINAPI VEHHandler(EXCEPTION_POINTERS* pExceptionPointers)
{
	PEXCEPTION_RECORD ExceptionRecord = pExceptionPointers->ExceptionRecord;
	ULONG_PTR AccessType;
	ULONG_PTR ExceptionAddress;

	switch (ExceptionRecord->ExceptionCode)
	{
	case STATUS_GUARD_PAGE_VIOLATION:
	{
		if (ExceptionRecord->NumberParameters < 2) return EXCEPTION_CONTINUE_SEARCH;

		AccessType = ExceptionRecord->ExceptionInformation[0];
		ExceptionAddress = ExceptionRecord->ExceptionInformation[1];
		auto MemInfo = TrackedMemory.find(ExceptionAddress);

		if (MemInfo == TrackedMemory.end()) return EXCEPTION_CONTINUE_SEARCH;

		if (AccessType == READ)
			std::printf("A read attempt was detected in the monitored memory address: 0x%p\n", (ULONG_PTR*)MemInfo->second->Address);
		else if (AccessType == WRITE)
			std::printf("A write attempt was detected in the monitored memory address: 0x%p\n", (ULONG_PTR*)MemInfo->second->Address);

		pExceptionPointers->ContextRecord->EFlags |= 0x100;

		std::puts("Proceeding with the code execution...");

		return EXCEPTION_CONTINUE_EXECUTION;
	}
	case STATUS_SINGLE_STEP:
		return EXCEPTION_CONTINUE_EXECUTION;
	}

	return EXCEPTION_CONTINUE_SEARCH;
}
Inside the EXCEPTION_POINTERS struct, we can extract another struct called EXCEPTION_RECORD, This struct contains information about the exception itself. Each exception has different kinds of information that can be extracted using the ExceptionInformation attribute, which is an array of ULONG_PTR values, which is an array of ULONG_PTR. The number of arguments available can be obtained from the NumberParameters attribute, and the type of each parameter depends on the specific exception that was triggered.
Since the STATUS_GUARD_PAGE_VIOLATION is undocumented on the ExceptionInformation structure, by some research I have found that it has the same information as the EXCEPTION_ACCESS_VIOLATION and by the Microsoft documentation it says:
“The first element of the array contains a read-write flag that indicates the type of operation that caused the access violation. If this value is zero, the thread attempted to read the inaccessible data. If this value is 1, the thread attempted to write to an inaccessible address.”
With that information, we are able to detect the type of access that occurred and its location. Now, let’s discuss this piece of code:
pExceptionPointers->ContextRecord->EFlags |= 0x100;
One aspect of the PAGE_GUARD mechanism is that immediately after the memory is accessed, the PAGE_GUARD flag is removed from the memory. Therefore, after completing our check code, we must decide whether the execution should continue. If it should, we need to instruct the CPU to perform a single step in the code. To achieve this, we turn on the TF (Trap Flag) to force the CPU to proceed with execution. The TF flag is stored in the EFLAGS register, and we can enable it by performing a bitwise OR operation with 0x100.
Once the TF flag is enabled, another exception will be raised, this time with the type STATUS_SINGLE_STEP. This is the point where we make another decision: Do we want to continue monitoring this memory? If the answer is no, we can safely return the EXCEPTION_CONTINUE_EXECUTION value, indicating to the operating system that we have handled the exception and are ready to continue execution.
In the provided example code, there is no need to continue monitoring the memory. However, in unpackers like Shinigami, this is the moment when we can use VirtualProtect again to insert the PAGE_GUARD bit and continue the monitoring process:
1
2
3
4
5
6
7
8
9
// Shinigami STATUS_SINGLE_STEP handler

if (GenericUnpacker::cUnpacker.IsBeingMonitored((ULONG_PTR)ExceptionRecord->ExceptionAddress) &&
	GenericUnpacker::cUnpacker.IsBeingMonitored((ULONG_PTR)pExceptionPointers->ContextRecord->XIP))
{
	VirtualQuery(ExceptionRecord->ExceptionAddress, &mbi, 0x1000);
	mbi.Protect |= PAGE_GUARD;
	VirtualProtect(ExceptionRecord->ExceptionAddress, 0x1000, mbi.Protect, &dwOldProt);
}
Testing
Perfect! Now that the concept of page guards and exception handlers is clear, let’s proceed with the unpacker design, using Shinigami as a reference since it is the one that I developed.
Overall Shinigami unpacker design
Since we are working with malware loaders, one of the prominent aspects is memory allocation and memory protection manipulation. It is crucial for us to keep track of every memory region used by the target malware. Additionally, since our solution run in user mode, we don’t have access to the special powers that a kernel mode driver would have.
One approach to address this is:
- Create the malware process in a suspended state
- Inject a DLL into the process, allowing us to hook into functions related to memory manipulation.
- By doing so, we can intercept any memory allocation or modification that may lead to code execution, such as the use of
PAGE_EXECUTE_READWRITEmemory regions.
- By doing so, we can intercept any memory allocation or modification that may lead to code execution, such as the use of
-
Append the
PAGE_GUARDflag to these newly created/modified memory regions. - Finally, we can register a custom Vectorized Exception Handling (VEH) handler to monitor whether these memory areas are being used for execution.
Hooking NT functions in Usermode
In order to perform the hooking, you have the flexibility to choose any technique you prefer. In my case, I selected the trampoline approach. However, you also have the option to utilize VEH hooking in your implementation, VEH hooking does not require modifying the target function directly. Instead it utilizes the STATUS_GUARD_PAGE_VIOLATION exception handler to modify the process instruction pointer (IP) and redirect execution to your code. One advantage of VEH hooking is its ability to evade certain anti-hooking mechanisms that specifically check for jumps or modifications within the hooked function.
NtAllocateVirtualMemory
When hooking the NtAllocateVirtualMemory function, we can leverage the fact that VirtualAlloc is a wrapper over it, this allows us to inspect the memory protections chosen for the newly allocated memory. If we detect that the memory is being allocated with any protections related to execution, we can append the PAGE_GUARD bit to it.
1
2
3
4
5
6
7
// Code snnipet from https://github.com/buzzer-re/Shinigami/blob/666c2579e0c17c4272d8c5c11df6b2c4dc012de2/Shinigami/Ichigo/Unpacker.cpp#L19

if ((ProcessHandle == NULL || GetProcessId(ProcessHandle) == GenericUnpacker::IchigoOptions->PID) && (Protect == PAGE_EXECUTE_READWRITE || Protect == PAGE_EXECUTE_READ || Protect & PAGE_EXECUTE))
{
	Protect |= PAGE_GUARD;
	Track = TRUE;
}
Then, we proceed with the regular invocation of the real function, allowing the memory allocation to take place. Simultaneously, we begin tracking the newly allocated address by storing relevant information in a data structure. In the case of Shinigami, an STL <list> is utilized as the data structure, holding some metadata about the allocated memory region (similar to previous example). This data structure is useful when searching the entire monitored memory of the loader for specific code or executables.
1
2
3
4
5
6
7
8
9
10
11
12
NTSTATUS status = GenericUnpacker::cUnpacker.Win32Pointers.NtAllocateVirtualMemory(ProcessHandle, BaseAddress, ZeroBits, RegionSize, AllocationType, Protect);

if (status == STATUS_SUCCESS && Track)
{
	GenericUnpacker::cUnpacker.Watcher.push_back({});
	Memory& memory  = GenericUnpacker::cUnpacker.Watcher.back();
	memory.Addr     = reinterpret_cast<uint8_t*>(*BaseAddress);
	memory.End      = reinterpret_cast<ULONG_PTR>(memory.Addr + AllocatedSize);
	memory.Size     = AllocatedSize;
	memory.prot     = Protect;
	PipeLogger::LogInfo(L"Tracking newly allocated memory 0x%lx with protections 0x%x", *BaseAddress, Protect);
}
Perfect! With our tracking mechanism in place, we can effectively monitor every request made by the malware for executable memory. Another important function to consider hooking is NtProtectVirtualMemory, which corresponds to the ultimate purpose of the VirtualProtect call. By intercepting and hooking this function, we gain insight into the protection changes made to virtual memory regions. This gives us the ability to analyze and potentially modify the protection settings as needed.
NtProtectVirtualMemory
When it comes to changing memory protections, we can follow a similar approach to the one used for memory allocation. When the protections need to be modified, we examine the new protection settings to determine if they include any execution flags.
1
2
3
4
5
6
7
8
if ((ProcessHandle == NULL || GetProcessId(ProcessHandle) == GenericUnpacker::IchigoOptions->PID) && (NewProtect == PAGE_EXECUTE_READWRITE || NewProtect == PAGE_EXECUTE_READ || (NewProtect & PAGE_EXECUTE)))
{
	// Add the PAGE_GUARD bit as well
	NewProtect |= PAGE_GUARD;
	Track = TRUE;
}

NTSTATUS status = GenericUnpacker::cUnpacker.Win32Pointers.NtProtectVirtualMemory(ProcessHandle, BaseAddress, RegionSize, NewProtect, OldProtect);
That way, even if the protections were initially non-executable, they will still be tracked.
However, it’s important to note that this approach has certain drawbacks and limitations. For instance, if the loader correctly maps the PE file in memory, certain parts of the memory may not be marked as executable and therefore won’t be tracked during the dumping process. This is a known issue in Shinigami, and it will be addressed in future releases to improve the tracking and monitoring of memory regions.
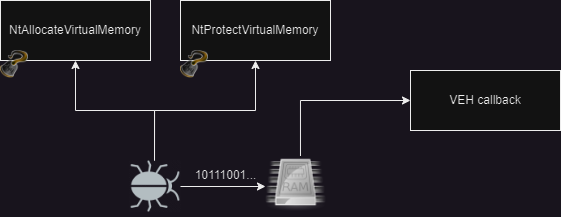
VEH callback implementation
Our exception handler implementation will be invoked whenever any of the tracked memory regions are accessed. Since our focus is on code execution, we will verify the exception address and the program’s instruction pointer. To facilitate the compilation of our program for both x86 and x64 platforms, we will define a macro.
1
2
3
4
5
#ifdef _WIN64
#define XIP Rip
#else
#define XIP Eip
#endif
(This simple macro idea was done by @fsx30, his article helped me to implement this handler btw.)
1
2
3
4
5
6
7
8
9
10
11
12
13
14
15
16
17
case STATUS_GUARD_PAGE_VIOLATION:
	//
	// Verify if it's being monitored and executing
	//
	if (GenericUnpacker::cUnpacker.IsBeingMonitored((ULONG_PTR)ExceptionRecord->ExceptionAddress) &&
		GenericUnpacker::cUnpacker.IsBeingMonitored((ULONG_PTR)pExceptionPointers->ContextRecord->XIP))
	{
		PipeLogger::LogInfo(L"STATUS_GUARD_PAGE_VIOLATION: Attempt to execute a monitored memory area at address 0x%lx, starting dumping...", ExceptionRecord->ExceptionAddress);
		ULONG_PTR StartAddress = (ULONG_PTR)pExceptionPointers->ContextRecord->XIP;
		Memory* Mem = GenericUnpacker::cUnpacker.IsBeingMonitored(StartAddress);

		if (GenericUnpacker::cUnpacker.Dump(Mem))
		{
			PipeLogger::Log(L"Saved stage %d as %s ", GenericUnpacker::cUnpacker.StagesPath.size(), GenericUnpacker::cUnpacker.StagesPath.back().c_str());
			GenericUnpacker::cUnpacker.RemoveMonitor(Mem);
		}
	...
Our first step is to verify if the faulted address falls within the range of the list that stores all allocated memory addresses. If it does, we retrieve the corresponding memory structure from the list, we are now prepared to proceed with the memory dumping process.
Dumping techniques
The approach you choose will depend on your specific requirements and analysis goals. In your case, you mentioned that you verify if the memory contains the DOS header. If it does, you rebuild the already mapped Portable Executable (PE) file to preserve section alignments. This video from OAlabs provides a good explanation of this process.
However, if the memory does not contain the DOS header, you only dump the executed code and save it to disk as binname_shellcode_shellcodenum.bin. This approach can be useful in scenarios where you are specifically interested in analyzing shellcode execution.
In general, this subject deserves another article dedicated to more in-depth memory dumping techniques, including heuristics and other advanced methods.
1
2
3
4
5
6
7
8
9
10
11
12
13
14
15
16
17
18
19
20
21
PIMAGE_DOS_HEADER PEDumper::FindPE(Memory* Mem)
{
    PIMAGE_DOS_HEADER pDosHeader;
    PIMAGE_NT_HEADERS pNtHeader;

    for (uint8_t* Curr = reinterpret_cast<uint8_t*>(Mem->Addr); (ULONG_PTR)Curr < Mem->End; Curr++)
    {
        pDosHeader = reinterpret_cast<PIMAGE_DOS_HEADER>(Curr);
        if (pDosHeader->e_magic == IMAGE_DOS_SIGNATURE)
        {
            pNtHeader = reinterpret_cast<PIMAGE_NT_HEADERS>((ULONG_PTR)pDosHeader + pDosHeader->e_lfanew);
            if ((ULONG_PTR)pNtHeader <= Mem->End - sizeof(pNtHeader) &&
                pNtHeader->Signature == IMAGE_NT_SIGNATURE)
            {
                return pDosHeader;
            }
        }
    }

    return nullptr;
}
Given a memory area, you can perform memory scanning until you find a region where both the DOS header and NT signature are present. Since we are examining the memory allocated by malware, we can confidently assert that we are dealing with an unpacked or loaded executable.
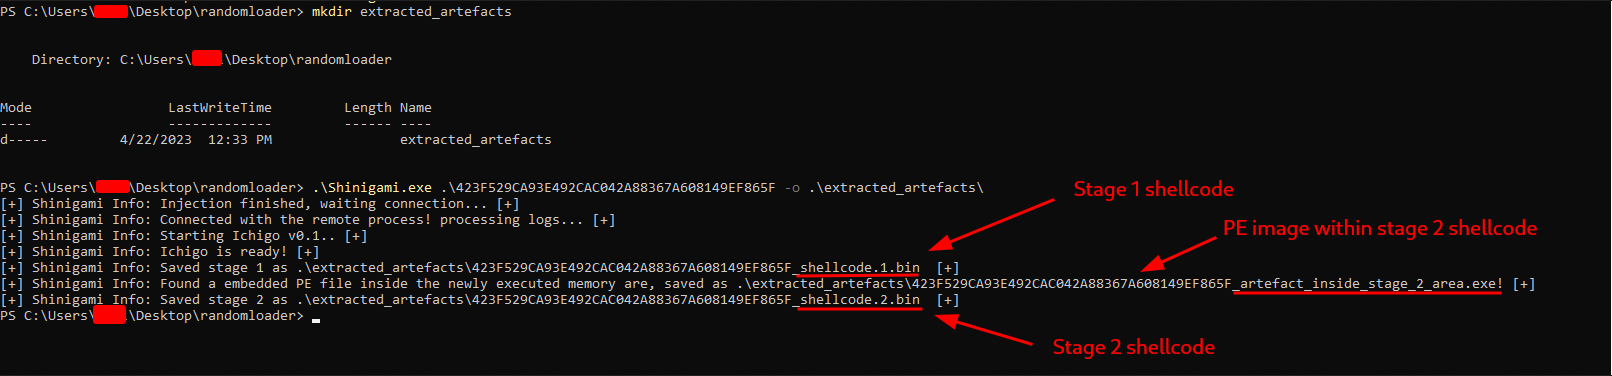
Testing
Perfect! With the comprehensive explanation provided, you now have a clear understanding of the spirit behind Shinigami. We are now ready to explore a use case. In this instance, we will examine a sample described in the post Manual Unpacking in Details. This sample aligns perfectly with our example as it involves a three-stage loading process, as follows:
- The first shellcode is responsible for decrypting the executable and the second shellcode
- The second shellcode handles the manual mapping of the executable.
- Finally, the manual mapped executable is executed.
Shinigami fits perfectally here:
Certainly! To explore the full range of options available in the Shinigami project, you can visit the GitHub repository at here.
Drawbacks and Future work
As mentioned earlier, there are some limitations and drawbacks to consider in this design. The primary drawback is that the current implementation relies entirely on user-mode execution and NT function hooking. This makes it susceptible to easy defeat through direct syscalls. To enhance the design, the addition of a helper driver to hook the System Service Descriptor Table (SSDT) and provide feedback on memory behavior in kernel mode would be beneficial.
Another drawback, which is currently being addressed, is the memory monitoring algorithm. The approach of only monitoring executable memory can result in the exclusion of certain properly mapped PE files. To overcome this limitation, a solution is being developed that involves the creation of a shadow memory. This shadow memory will track all data written and allocated by the binary, utilizing the Vectorized Exception Handling (VEH) mechanism when a write fault occurs. Also I’m exploring optimizations to ensure efficient performance during this process.
Also, anti-hooking techniques employed by malware with anti-EDR capabilities pose another challenge. While not currently under active development, ideas for mitigating these techniques include replacing trampoline functions with VEH hooking and exploring additional approaches. A detailed exploration of these techniques will be covered in a separate article.
Conclusion
I hope that you have found this research to be valuable for your work. The process of conducting this research has helped my understanding in various concepts, because practical experience is often more valuable than theoretical knowledge alone.
I have a strong passion for anti-malware research, and as a result, I plan to contribute more content in this area. While there is already an abundance of resources available on malware development, there are limited materials related to anti-malware techniques and research.
That’s it, thanks.